
Q2 2023 Market Commentary - Magnificent Seven Rally
- RISE Investments

- Jun 30, 2023
- 8 min read
Updated: Feb 25, 2025
Future economic growth remains uncertain as many economists are predicting a recession, despite relatively resilient economic fundamentals.
Monetary policy tightening has been renewed by global central banks in their continued attempt to bring down sticky inflation. The Federal Reserve is currently hinting towards two additional rate hikes by the end of 2023.
Despite broader economic concerns, equities rallied in the second quarter, driven primarily by a very narrow group of mega-cap stocks.

Market Overview
Investment performance throughout the second quarter was driven by an incredibly limited group of mega-cap stocks (i.e. companies that have a market capitalization of $200 billion or higher), which have been dubbed the “Magnificent Seven”. These stocks include Apple, Microsoft, Alphabet, Amazon, Nvidia, Tesla, and Meta. Combined, they generated over 70% of the S&P 500’s 16.8% year-to-date total return while over 350 of the roughly 500 companies in the index posted year-to-date returns below 16%.

We believe the main drivers of the Magnificent Seven’s rally can be summed up to:
Their exposure to artificial intelligence (AI), which some believe will spur a massive productivity boom.
A “relief rally” following significantly negative performance in 2022.
An injection of liquidity into the market as the Federal Reserve depleted their Treasury General Account (i.e. The Fed’s “checking account”) leading up to June.
Hopes that weakening inflation will cause the Federal Reserve to pivot to a more dovish monetary policy.
Perception that the macroeconomy will return to the 2010’s playbook of low inflation, near-zero interest rates, and low real economic growth.
Price-to-Earnings valuation multiple expansion.
These seven companies now make up nearly 30% of the market capitalization-weighted S&P 500 index, which is the highest in recent history.

While this bode well for index investors year-to-date, these investors now have reduced diversification benefits within the S&P 500 index and are significantly overweight to the “expensive” Magnificent Seven stocks and the information technology sector. The price-to-earnings ratio (P/E - price divided by earnings) is frequently used as a data point to justify whether a stock is cheap or expensive, and thereby inferred to be predictive of upcoming price movements. If one could buy $1 of Company A’s earnings for $10 (a P/E ratio of 10), why would one buy shares of Company B for $16 with the same $1 of earnings (a P/E ratio of 16)? The answer comes down to one’s long-term growth expectations for the company. If growth expectations for a stock are higher, the stock comes with a higher P/E ratio. Yet, this isn’t without risk. Should Company B’s actual future growth not end up meeting expectations, the P/E ratio of that stock will fall.

Unfortunately, several CNBC commentators solely look at the market capitalization-weighted S&P 500 index as a proxy for market performance. At RISE Investments, our investment opportunity set is global, which has had a range of performance. For instance, we view the equal-weighted S&P 500 index as a gauge of performance for the typical stock, as it does not overweight the largest companies, such as the Magnificent Seven. The equal-weighted S&P 500 index posted a 4% total return in Q2, relative to the market capitalization-weighted index at 8.7%.
The industry sector with the strongest Q2 performance was information technology, with its performance driven primarily by its heavy business exposure to AI. Conversely, economically sensitive sectors such as financials, energy, and materials, lagged as investors priced in a “hard landing” for these stocks due to slowing economic growth.

Year-to-date performance of non-U.S. markets has remained rather resilient. International developed markets, such as Western Europe, Japan, and Australia returned 3.2% in Q2, driven by better-than-expected economic growth, warmer weather, and cheaper valuations overall. However, Q2 emerging market performance was lower at 1.3% due to uncertainty of U.S. dollar liquidity and questions about China’s reopening.
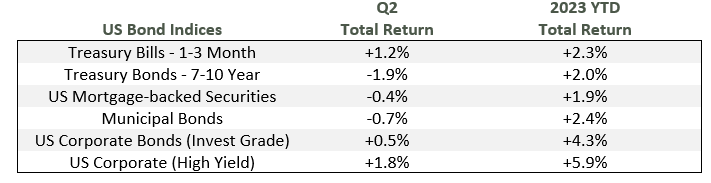
Within the fixed income asset class, the Bloomberg Barclays Aggregate bond index returned -0.9% amidst continued regional banking uncertainty and multiple interest rate hikes by Federal Reserve. Longer-dated Treasury bond yields were rangebound, with 10-Year Treasury Note yields ranging from 3.25% to 3.85% in the quarter. U.S. high yield corporate bonds returned 1.8% in the quarter. While high yield bonds outperformed investment grade over the quarter, the outperformance came with what we believe to be an outsized amount of risk. Because of this, our preference for higher credit quality and shorter duration fixed income remains, as high yield and longer duration bonds tend to be more vulnerable to potential defaults in rising interest rate environments, among other factors.
Economic Outlook
The current economic landscape has perplexed economists due to the large number of possible outcomes. As President Harry Truman once stated:

In his dislike, we would say on one hand the economic outlook looks murky, driven mainly (but not entirely) by the following factors:
Regional bank turmoil’s effect on bank deposits and lending
Uncertainty related to China’s re-opening
Further monetary policy tightening by global central banks
Continued war in Eastern Europe
Declining leading economic indicators
Significant distress in the commercial/office real estate market
Yet like any well-trained economist, there is always the other hand, which are “the positives”:
High and growing disposable personal income
Record high net worth of U.S. households
Stimulative fiscal policy
Inflation adjusted interest rates, or “real rates”, near historic lows
Favorable housing and inventory activity as of Q2
Strong labor market despite the Fed hiking interest rates by over 500% on a relative basis since March 2022
Most economic forecasters are currently projecting a high likelihood of a recession hitting in the second half of 2023. We have been hearing consistent bantering that the next recession is “likely 6 months ahead” but that it will be a shallow “garden type” recession, as if it is out of convenience for the given Wall Street strategist. While we cannot rule out a near- term recession as a possible outcome, whether it come this year or in 2024, we are mindful that recessions are rather infrequent, with the catalyst tending to be an exogenous shock as history suggests:
Early 1990’s recession – Collapse of over 1,000 savings and loan institutions (1/3 of total)
Early 2000’s recession – September 11th terrorist attacks & collapse of technology bubble
Great Recession of 2008 – Near death experience for major global banks & freezing of global credit
COVID-19 Recession of 2020 – Shutdown of major economies for several months
Take disposable personal income for example. Wage gains, cost of living adjustments for social security and marginal tax rates, and higher investment interest income has driven disposable income up 8% year-over-year. Disposable personal income is now higher than 2020 levels, despite the fact that today, consumers are no longer flush with pandemic-induced government stimulus checks and nowhere to spend them like in 2020.

Another example that does not get nearly the attention we believe it deserves is the growth of U.S. household net worth. Coming out of the Global Financial Crisis, the bottom half of Americans had a combined net worth of $370 billion. Today, that figure stands at $3.44 trillion for this massive cohort. Higher household net worth is supportive for personal expenditures, confidence, and debt servicing; and all of which can support broader economic growth.

Lastly, you do not need to be a political expert to recognize the discourse in Washington D.C. Yet, the current administration is running an outsized fiscal deficit relative to the macro backdrop. Simply put, this leaves relatively more dollars in the real economy. Additionally, a higher proportion of fiscal outflows are Treasury bond interest payments, which bolsters disposable income for Americans holding risk-free Treasury instruments.
The bottom line – while we do not see any clear silver linings today, we do see indicators that suggest the economy may be on better footing relative to what the media pundits are conveying. Our view is that it’s not out of the question that the economy may continue muddling through the second half of 2023, avoiding a technical recession until next year or perhaps dodging it all together.
Stock Market Mean Reversion
Jason Zweig, the leading Wall Street Journal columnist of The Intelligent Investor, is a realist who sells to optimists and buys from pessimists. He says, when optimism rises to unstainable levels, stocks become too expensive. When pessimism reaches unjustified highs, stocks become too cheap, or undervalued.

The Intelligent Investor could not be more correct with the emotional swings and complacency of investors, especially today. We see instances of this irrational sentiment (both the unsustainable optimism and unjustified pessimism) in today’s stock market, which is rising from the massive outperformance of just a few mega-cap stocks while roughly 40% of S&P 500 index constituents are currently in negative year-to-date performance territory.
As noted by Bank of America Global Investment Strategy, U.S. mega-cap technology price performance relative to the S&P 500 index as a whole are approaching two standard deviation outperformance levels (based on data since 1926).
In other words, this level of outperformance has only been seen in three out of 97 years since 1926. Historical outperformance episodes include the COVID-19 pandemic (2020), the Dot-Com Bubble (2000), and the Nifty 50 Bubble (1970). However, on a forward basis, owning the most glamorous and highest market value companies at the end of each decade tends to be a losing proposition, as the outperformers tend to underperform the S&P 500 the following decade after the run-up.
As we enter the second half of 2023, we see four potential catalysts that could drive a reversion of the very narrow stock market rally that we’ve witnessed year-to-date:
If the U.S. economy avoids a recession
Investors pair back their record-high money market holdings and shift to a “risk-on” approach.
Market pessimism towards undervalued “value” stocks begins to fade
Capital begins to flow back through the entirety of the U.S. stock market and not just overvalued mega-cap growth stocks.
A hawkish Federal Reserve continues to tighten monetary policy and liquidity in the financial system
Favors neglected industry sectors such as materials and energy, relative to technology.
The unsustainably high AI mania fades
Results in shrinking growth expectations for mega-cap technology, driving a reversion of the sky-high P/E ratios of these companies. However, evolutions of this sort tend to take time to evolve and play out.
Time is the friend of the patient investor. While the AI mania that was a guiding force of Q2 2023 bode well for those that were overweight the mega-caps, we believe the mania is currently overblown relative to the maturity level of AI in general. AI may end up changing the world like the internet began to do in the early 2000’s. Yet, history suggests the path forward from here for AI will be bumpy and is likely to come with reversions and corrections, just like the burst of the dot-com bubble in the early 2000’s prior to the internet maturing to what we know it as today.
Therefore, we are remaining patient and sticking to the long-term conviction of our relative value-based positioning and investment philosophy, albeit with an underweight, but not zero allocation to mega-cap growth stocks.
Conclusion
Stocks are always climbing a wall of worry, and market gyrations can often serve as reminders of the value offered by robust investment portfolio allocation framework, which we believe is most often critical to achieve sustainable wealth generation and financial success.
We remain optimistic for the long-term prospects of your capital positioned within RISE Investments’ portfolio allocation framework, and we encourage you to reach out if you have any questions or if you’d like to discuss this update.
Disclosure
RISE Investment Management, LLC ("RISE" or "RISE Investments") is an investment adviser registered under the Investment Advisers Act of 1940. Registration of an investment adviser does not imply any level of skill or training. This publication is solely for informational purposes and past performance is not indicative of future results. Any historical returns, expected returns, or projections are provided for informational purposes only. Any description of products, services, and performance results of RISE contained in this publication are not an offering or a solicitation of any kind. No advice may be rendered by RISE Investments unless a client service agreement is in place. Advisory services are only offered to clients or prospective clients where RISE Investments and its representatives are properly licensed or exempt from licensure. All of the information in this publication is believed to be accurate and correct as the date set forth. RISE does not have or accept responsibility or an obligation to update such information.